Workplace Happiness and Engagement Trends
- By
- Steve Williamson, VP Digital Marketing and Content, eRep, Inc.
- Posted
- Monday, September 5, 2022
About Happiness Index
Happiness Index is an employee and individual happiness and engagement measurement tool available at eRep.com. It is available for free to any individual who completes a full Core Values Index™ psychometric assessment, and is also included at no charge with all employer accounts at eRep.com.
→ Learn more about Happiness Index at erep.com/employers/happiness-index/
→ Sign up for an employer account at erep.com/sign-up/employer/
→ Take the Core Values Index psychometric assessment at erep.com/core-values-index/
What sets Happiness Index apart from all other happiness and engagement surveys is that results are calibrated to each individual's CVI profile. What matters to one person may not matter as much to another person, and their Happiness Index assessment factors that into their results.
Using a standardized set of questions, happiness is measured in five different categories:
- Connectedness
- Processes
- Fairness
- Challenges
- Inspiration
All results are presented as a percentage from 0% to 100%. 100% represents full engagement and happiness potential. Easy to read graphs are provided that indicate when improvement is required, when there is room for improvement, or when the individual (or group) is doing great.
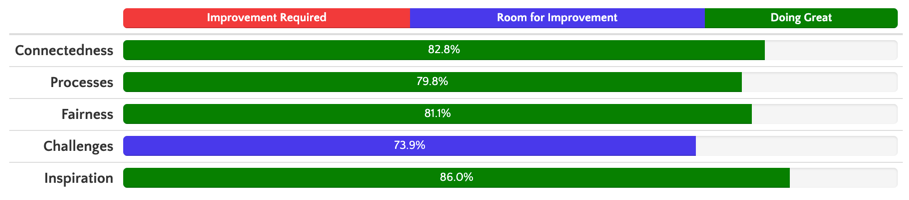
Figure 1. Sample Happiness Index results graph
Even though each individual's results are calibrated to their specific CVI profile scores, all results are presented in a standard 0-100% format that makes them intuitively easy to read and compare.
Individuals who have completed the CVI can take personal Happiness Index surveys as often as they like. Those survey results are kept confidential and cannot be seen by their employer.
Happiness Trends
According to eRep's survey data based on its Happiness Index employee engagement tool, used by a wide range of employers in many different industries, here's what we've learned about who's happy in their work and who isn't.
- Merchants feel the need for Connectedness the most, and are found wanting more. They have the lowest feeling of connectedness of all four core values, at only 77.2%. Bankers feel the most connected at 87.0%.
- Merchants again have the lowest happiness score in Processes, at only 77.4%. Bankers again take the top spot at 83.0%.
- Of the four core values, Innovators experience the greatest level of Fairness in their roles at 82.3%. Builders feel they have the lowest Fairness score at 79.7%.
- Both Innovators and Merchants feel the greatest need for improved Challenges in their jobs, sharing a score of 71.4%. Bankers feel the most satisfaction from challenges at 77.9%. Overall, Challenges received the lowest average Happiness Index score across all four core values, at an average of 73.9%.
- Builders feel the most inspired. Their Happiness Index score in the Inspiration category was 89.3%, while Merchants feel the least inspired at a still relatively high Happiness Index score of 83.1%.
Some industries experience greater Happiness Index scores than others.
- For example, administrative businesses had an average score of 82.7% while businesses in the insurance industry had an average happiness score of 92.9%. Those who work in that field reported a sense of high fairness at 94.2%.
- Construction and related trades reported a high sense of Connectedness at 95.1%, and a 95.5% score for Challenges.
- The highest category score went to the safety and security services sector, with a 95.5% Happiness Index score in the Challenges category.
- Across all industries, Inspiration is the category that has the most need for improvement, with an average Happiness Index score of just 72.3%. Connectedness was highest with an average score of 89.8%.
- The happiest workers are Builders working in the Construction trades, with an average Happiness Index score of 95.8%. The least happy workers (relatively speaking) are Innovators working in Healthcare, with an average score of just 81.0%, still well within the "doing great" range.
Core Values Index™ and CVI™ are trademarks of Taylor Protocols, Inc.
Go to eRep.com/core-values-index/ to learn more about the CVI or to take the Core Values Index assessment.

Steve Williamson
Innovator/Banker - VP Digital Marketing and Content, eRep, Inc.
Steve has a career in project management, software development and technical team leadership spanning three decades. He is the author of a series of fantasy novels called The Taesian Chronicles (ruckerworks.com), and when he isn't writing, he enjoys cycling, old-school table-top role-playing games, and buzzing around the virtual skies in his home-built flight simulator.
View additional articles by this contributor
Share This Article
Essentials
Additional Reading
Stay Updated
Employer Account Sign-up
Sign up for an employer account and get these features and functions right away:
- Unlimited Job Listings on eRep.com
- Applicant Search
- Applicant Tracking System (ATS)
- Unlimited Happiness Index employee surveys
- 3 full/comprehensive CVIs™
- No credit card required — no long-term commitment — cancel at any time
Write for eRep
Are you interested in writing for eRep? Read our submission guidelines.